
AI's Most Important Number Has Never Been Measured

I thought the machines were going to take most of the work. I set out to find out how much, and ended up taking my own argument apart. The tools that would settle it have been sitting unused since the 1970s. I still think it is coming. The answer is just stranger than a yes or a no.
Sooner or later, machines will do most of the work that people are now paid to think about.
Ten years ago that was a thing you said at the end of a talk, when the slides were finished and nobody was taking notes. Now it turns up in capital expenditure plans, as laboratories ship systems that write production code and read scans, treasuries model it into growth forecasts, and investors price it as the largest reallocation of labour since the field was mechanised. Whatever it is, it has stopped being a thing people speculate about and started being a thing people budget for.
Almost all of the argument is about timing and about winners. How many jobs go and how fast, which firms capture it, whether the models are reasoning or performing, whether any of this is safe. I have spent months on the last of those, arguing that the gains end up in very few hands and that everyone else gets poorer slowly enough that nobody names the day it began.
Underneath all of it there is a question that has to be answered first, and hardly anyone asks it out loud.
How much larger does an economy actually get when the machines can do the work?
Not when, and not who wins, but how much. The work here is knowledge work, the thinking part of the economy, which is where these systems arrive first. I went looking for that number expecting to find a large one and an argument about dates. The answer is a curve with nobody standing on it.
Start with the doctors
In the profession that intuition marks as the most human of all, doctors spend more of their working day on paperwork than on patients.
This is not an impression. In a direct observation study published in the Annals of Internal Medicine, researchers followed 57 physicians across four specialties and four American states for 430 hours, stopwatch in hand, recording what each was doing minute by minute. Direct clinical face time with patients came to 27.0% of the day. Electronic health records and desk work came to 49.2%, and even inside the examination room, with the patient physically present, only 52.9% of the time was spent face to face.
Nobody measured this in order to say anything about artificial intelligence. The study was funded by the American Medical Association and published in 2016, and its point was physician burnout.
I read it the way I suspect you just did. Three quarters of medicine is not medicine but administration, documentation and coordination, and administration, documentation and coordination are exactly what these models are good at. If that pattern holds across the professions, the ceiling is enormous and the argument is over before it starts.
That reading is wrong. Working out why took me through two results I was not looking for, and ended with me taking my own argument apart.
The whole thing hangs on one number
Suppose some fraction of the work cannot be sped up at all, and call it f. Speed up everything else without limit and the total gain does not run away. It converges to one divided by f.
This is Amdahl’s law, from a four page paper about parallel processors in 1967, and it is the least controversial thing here.1 If a quarter of the job stays where it is, the ceiling is four times. If a fifth stays, five. If a tenth stays, ten.
Look at what that does to the debate, because the answer swings by an order of magnitude on the value of a single number, the number has nothing to do with the technology, and you do not need to know anything about the models to compute it. You need to know how much of the work has to stay human.
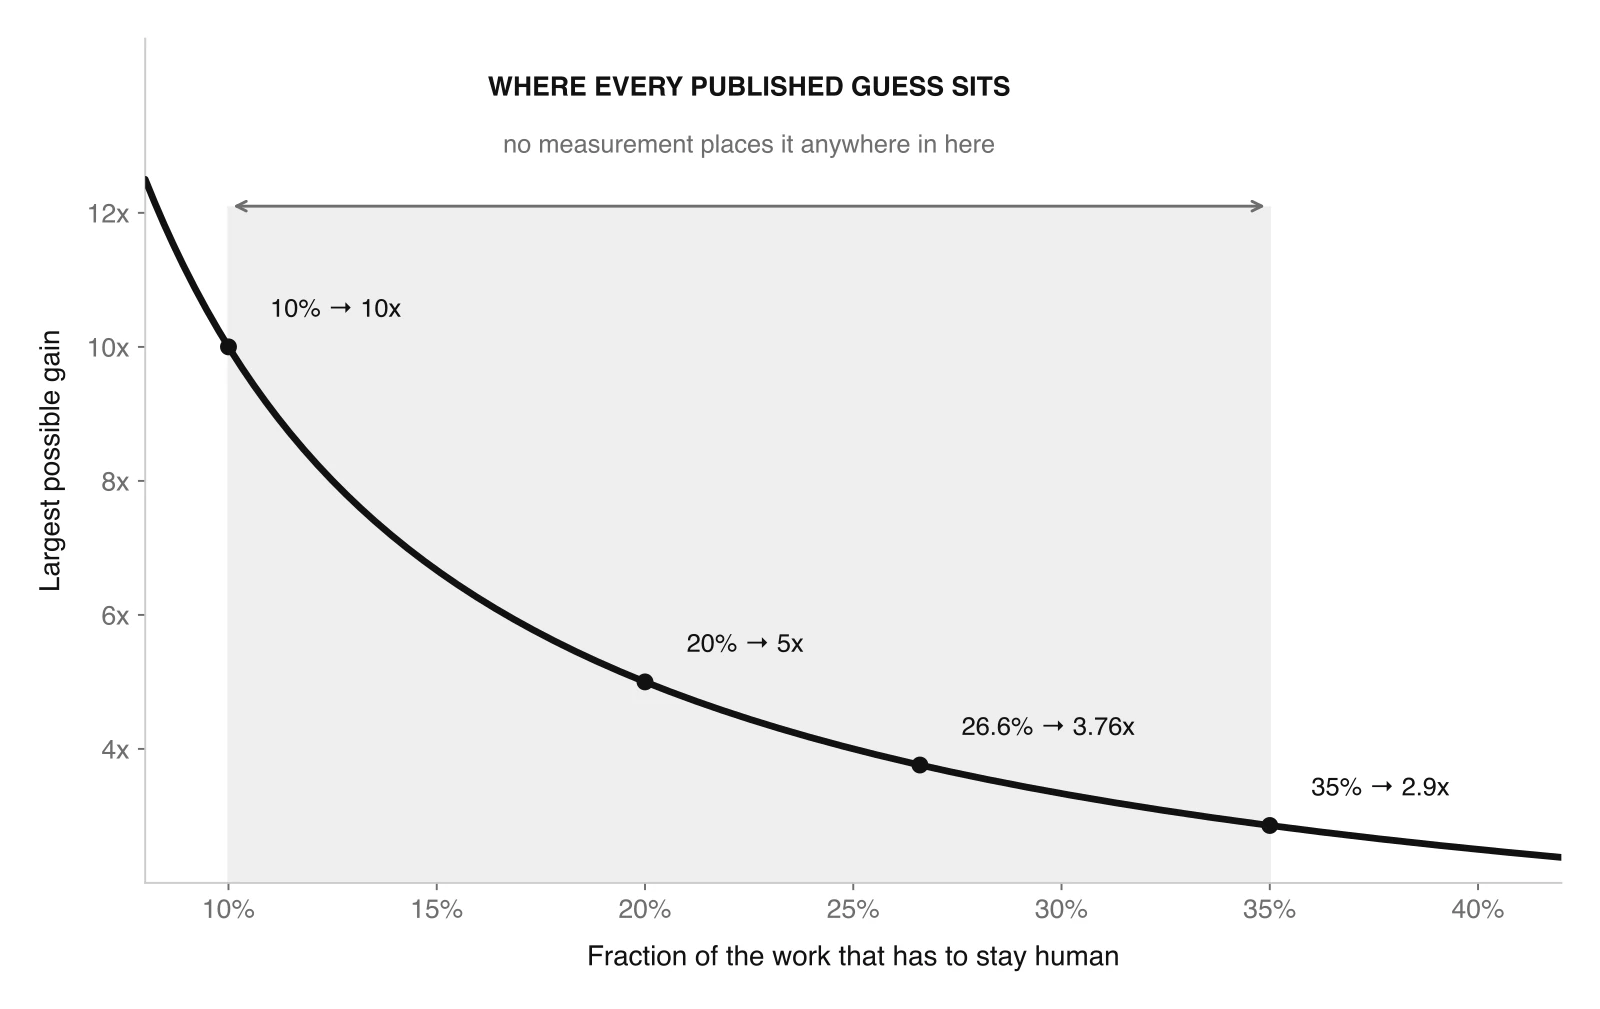
So I went to find out, and that is where the trouble starts. It took me most of a year to see it.
Five experiments that look like a contradiction
The literature that ought to settle how much these tools actually do looks, at first reading, like a mess.
Noy and Zhang randomised professional writing tasks among 453 college educated professionals and found time down 40% and quality up 18%, with the gains concentrated among the weakest writers. Peng et al randomised a from-scratch programming task and found the assisted group finished 55.8% faster. Cui et al pooled three field experiments across 4,867 working developers at Microsoft, Accenture and a Fortune 100 electronics firm and found 26% more output, larger for the short tenure. Brynjolfsson, Li and Raymond followed 5,179 customer support agents through a staggered real deployment and found 14% on average, 34% for novices, and no measurable effect on the experienced and highly skilled.
Then METR ran the most careful trial of the set, on sixteen experienced open source developers working in repositories where they averaged five years of history, across 246 real issues with 143 hours of screen recording labelled by hand, and found they were 19% slower with the tools than without.
Beforehand those developers had predicted a 24% speedup, economists asked to guess said 39%, and machine learning researchers said 38%. Afterwards, having done the work, the developers themselves still estimated they had gained 20%.
It is tempting to read the METR result as the one honest measurement and the rest as noise. That reading does not survive the numbers.
The five studies are one result measured at five points along a single axis. Every one of them finds the same thing once you sort them by how far the worker already was from what the model can do. Writing tasks given to people who are not writers, largest effect. Synthetic coding tasks with no existing context, very large. Real developers on unfamiliar work, moderate. Support agents with scripts and novices, large for novices and nothing for experts. Experienced maintainers inside codebases they built, negative.
The uplift is not a property of the technology. It is a property of the distance between the worker and the model.
Brynjolfsson states the mechanism outright. The system works by capturing and disseminating the behaviour patterns of the most productive agents, including tacit knowledge that had previously eluded automation, and helping newer workers move down the experience curve. The system is compressing a performance distribution, and a distribution can only be compressed once.
How much room is there, really
If the gain comes from levelling everyone up toward the best performer, then the total available gain is bounded by how far apart the best and the average already are. It is a measured quantity, and it was measured long before any of this.
Hunter, Schmidt and Judiesch assembled 68 studies of actual work output and 17 work sample studies, corrected them for measurement error and for range restriction, and computed the standard deviation of individual output as a percentage of mean output. It rises with job complexity, from 19% for low complexity work to 32% for medium and 48% for high complexity professional and managerial work.
From those figures they compute what the top 1% produce relative to the average, taking as the base everyone who might do the job rather than only those already doing it. It is 1.52 times in low complexity work, 1.85 in medium, and 2.27 in high complexity work.2
The same paper then gives three separate reasons why 2.27 is too low.
The authors say so outright. These distributions are positively skewed rather than normal, and in a positively skewed distribution the top 1% sits further above the mean than the normal model places it.
They also threw out their most extreme case. One study of high complexity work never entered the averages, because extracting a standard deviation from it would have required assuming a normal distribution and the authors would not assume one at that level of complexity. It was a study of computer programmers, in which the most productive produced sixteen times the output of the least productive.3
And their model puts the floor in an impossible place. For high complexity work it predicts negative output at the bottom of the distribution. The authors conclude that the true bottom sits at or near zero, and their words for why are that low performers in these occupations cannot learn the job at all.
Put those three together and the compression changes character. It is not everyone getting somewhat better, but a tail of people who could not do the work at all becoming able to do it, which is precisely what a 34% gain for novices and a zero gain for experts looks like from the inside.
This was the first result I was not looking for. The largest gain available from this technology asks nothing of the machines beyond what they already do. It requires only that they carry what the best person in the room already knows to everybody else, and it stops at a number that was measured in 1990.
Where the individual gain goes to die
There is a second literature that measures the same thing one level up.
Economists have been estimating efficiency frontiers since the 1970s, and the two standard tools arrived within a year of each other, data envelopment analysis from Charnes, Cooper and Rhodes in 1978 and stochastic frontier analysis from Aigner, Lovell and Schmidt in 1977. Both take observed inputs and outputs across a set of organisations and work out how much input the best of them needs to produce a given output, which makes the benchmark a real practice rather than a theoretical bound. The gap between a unit and that frontier is called technical inefficiency, and it is exactly the compressible slack.
Where it has been pointed, it gives real answers, and they are not the same answer twice. A stochastic frontier study of hospital diagnostic laboratories in Iran put mean technical efficiency at 93.1%, leaving about 7% of the input recoverable. The same laboratories analysed by data envelopment analysis came out at 98.3%, leaving 1.7%. A comparison of methods across English hospitals concluded that there are not truly large efficiency differences between them. And at the other end, governmental hospitals in Palestine averaged 55%, which is 45% of the output recoverable from the same resources.
The sites differ, and so do the instruments. A diagnostic laboratory in a working system and a governmental hospital in a strained one are not drawing from the same world, and each method draws the frontier its own way, which is how the same laboratories can come out five points apart under the two instruments.
The compressible slack inside organisations is real, measurable, and enormously dependent on where you look. It also never gets anywhere near the individual number.
Hunter’s 2.27 means 127% more output from moving the average to the top. Set that against the frontier, output per person against input per organisation, and the most slack-rich setting anyone has measured offers 45%. The typical one offers under 10%. The gap holds at every point in the range.
The reconciliation is not that one of them is wrong, but that an organisation is already an average. It has the excellent surgeon and the mediocre one, the good territory and the bad, the strong team and the weak, and it pools them before anything is measured. Individual variance is real and enormous, and most of it disappears on aggregation.
That took me a while to accept. The five experiments measure individuals, and the economy is made of organisations. Between the two there is a step that nobody in this argument has costed, and the one literature that has measured that step says the room up there is small. That was the second result I was not looking for.
What the stopwatch actually measured
By now I had what looked like a complete argument. Compression is bounded by human variance, everything beyond it requires the machine to beat the best person alive, and the whole thing is capped by whatever fraction of the work stays human, which is where the doctors came back in.
So I built the fraction. Direct patient contact for physicians, instructional time for teachers, where American teachers spend 27 hours instructing out of a 45 hour working week and the federal statistics agency puts it at 28 hours inside 46 worked, and interactive time for executives, taken from the largest study of executive time that exists, which followed 1,114 chief executives of manufacturing firms across six countries for a week each and logged 42,233 separate activities. Weighted against the 6.90 trillion dollar knowledge work wage bill, it came to about a quarter, and a quarter puts the ceiling near four times.
I was pleased with that number for months, and it is wrong for a reason that is embarrassingly simple.
A stopwatch measures what somebody did, not what somebody had to do.
The physicians in that study spent 27% of the day with patients. Nothing in the study asks whether those minutes could be shortened, batched, shared, moved to a different point in the visit, or handled differently altogether. The authors were counting burnout rather than necessity, and a teacher instructs thirty children or one, and the stopwatch reads the same either way. A chief executive holds an hour long meeting that could have been ten minutes, and the stopwatch records an hour.
The doctors are not a special case. A time and motion study of emergency nurses found them spending more of the shift on the electronic health record than on patients, 27% against 25%. The same profession, the same inversion, a different decade.
And nursing shows the deeper problem inside a single study. Work sampling on surgical wards puts direct patient care between 40% and 56% of the shift, while the same study finds nurses actually at the bedside 31% of the time. Direct care and being in the room are not the same category, and which one you count moves the answer by anything from nine to twenty five points. None of these studies was asking what the minimum is. They were asking where the time goes.
The same mistake is being made at the other end of the argument, in public. In April 2026 Sundar Pichai put the share of new code at Google written by machine at 75%, up from a quarter eighteen months earlier, and each time Google has published that number it has paired it with the words reviewed, accepted or approved by engineers. Writing code is somewhere between 9% and 61% of a developer’s day depending on the study, with one large survey putting new and improved code at 32%. Lines are not work, and the ratio between them has never been established either.
Every one of those numbers is a description of a habit. I had been treating them as descriptions of a requirement.
And the error runs in both directions, which is what makes it fatal rather than merely conservative. If half the physician’s paperwork is administrative theatre that a sane system would delete without any machine at all, then the compressible portion is smaller than it looks. If half the contact time is custom rather than clinical need, the irreducible portion is smaller too. Neither has been measured, and I had built a ceiling out of two quantities that nobody had established, and then computed a reciprocal to three significant figures.
The part I wanted to be physics and is not
One version of the argument survives this, and I spent weeks trying to make it work.
Certain work is not waiting for better machines because the obstacle was never capability. A primary school teacher cannot supervise a room from somewhere else. A negotiation needs a party with something to lose. The blocking condition is not that the task legally requires a human, which is a weaker thing than it sounds. A radiologist must sign the report, but the signature takes seconds. If the machine does the reading, the radiologist becomes three times faster and continues to sign everything, and two thirds of that time has been automated with the legal requirement exactly where it was. Licensing blocks substitution. It does not block compression.
The obvious reply is robots, and for a good deal of this work the reply is right. Grant it in full for surgery, where a machine with better outcomes would be chosen over a person and the preference for a human hand does not survive the statistics.
What is left is not physics but arrangement, since we still require a person to be the responsible party rather than the instrument in certain places, with a seven year old in a classroom, a signature on a contract, and a decision somebody has to answer for.
I do not believe that arrangement is stable, because people already talk to these systems every day, form attachments to them, and in some cases describe relationships with them. Put that together with working robotics and the requirement that a person be present starts to look like a habit with an expiry date rather than a law of nature. Which means the ceiling I had built rests on something I expect to dissolve. That expectation is a hypothesis, not a result. Nothing in this essay measures it.
The tools have been sitting there since the 1970s
So the quantity everything hangs on has never been measured, and I cannot supply it either.
It is measurable. The equipment has been in the building for fifty years.
Frontier analysis exists precisely to separate what an organisation uses from what best practice already achieves. It has been pointed at hospitals, at bank branches, at public libraries and at diagnostic laboratories. It will not hand you the theoretical minimum, because it can only see the units in the sample. It will hand you the lowest input anybody has actually managed, which is a great deal more than an average and is the closest thing to a floor that exists. Nobody has ever asked it how little human time a job needs.
What that study would look like is not mysterious. Take an occupation and establish the outcome rather than the activity, so that a physician is measured on resolved presentations rather than on minutes in the room. Estimate the frontier across enough practices to see the best, and then ask how much human contact time the frontier practice actually uses per resolved case, and whether that number has moved as the tools arrived.
One other measurement would help almost as much, which is randomised productivity trials repeated annually on a constant protocol, so that the uplift curve can be watched flattening or not flattening. The compression story makes a hard prediction there, that measured gains should fall as adoption saturates and the distribution runs out of tail, and nobody is testing it.
None of this is expensive, since a stopwatch study costs a fraction of one training run.
What this leaves
I still think the machines will do most of the work. They have started, and the record is smaller than the conversation suggests.
Corporate payment records show the first micro level evidence of firms substituting AI for contracted labour, at roughly three cents of additional AI spending for every dollar of online labour that disappeared. Economists at the St Louis Fed asked a nationally representative sample how many extra hours they would have needed without the tools and put the saving at 5.4% of hours among users and 1.4% across the workforce. Denmark, with administrative data on eleven of the most exposed occupations, rules out effects larger than 2%. Every one of those lands at a few per cent.
What I no longer believe is that anyone can tell you how much bigger the economy gets, including the people who publish numbers, and including me for most of a year. The arithmetic is sound and the inputs are not established. Every confident figure in this debate, in either direction, is a reciprocal computed from a habit.
The largest effect currently available from this technology runs in the opposite direction to the fear. It is not raising a machine above us. It is raising people into work that had been closed to them, and the study that bounds all of this is explicit about who stands at the bottom of complex work, which is people who could not learn the job at all. That effect is measured, it needs no further progress, and almost nobody is counting it.
It sits uncomfortably beside the only labour market signal anybody has found, which is a 16% relative decline in employment for 22 to 25 year olds in the most exposed occupations. Compression raises the output of people already inside a job. It does not create the junior tasks people used to enter through, and it may well remove them. Productivity and career are different variables, and at the entry point they appear to be moving in opposite directions.
Somebody once pointed a stopwatch at a doctor and found that three quarters of medicine is not medicine. That single act of measurement has done more work in this argument than every forecast in it. It also answered a different question, because nobody had thought to ask this one.
The right question is how little human time a piece of work actually requires. It is answerable. It has been answerable since 1978. Nobody has asked it, and until somebody does, the honest answer to how much larger this makes the economy is that we do not know, and that the people telling you otherwise are reading a habit and calling it a law.
-
Amdahl made the argument about parallel processors in a four page paper at the 1967 Spring Joint Computer Conference, arguing against the then fashionable view that you could always throw more processors at a problem. The argument generalises to any partial speedup, which is why it turns up in contexts he would not have recognised. ↩
-
Hunter and colleagues report two sets of figures, one for people already in the job and one for the pool of people who might be hired into it, and 2.27 comes from the second. For most occupations the second is the larger, because hiring has already removed the bottom of the distribution. For the professions in their sample it is barely larger at all, because they drew on national surveys covering the whole field and applied no correction for it. ↩
-
Rimland and Larson, Individual Differences: An Underdeveloped Opportunity for Military Psychology, Journal of Applied Social Psychology 16, 1986. The folklore about the ten times programmer is usually traced to Sackman, Erikson and Grant in 1968. Rimland and Larson is the version that reached the meta-analytic literature, and it survives there mainly as a parenthesis inside the paper that discarded it. ↩